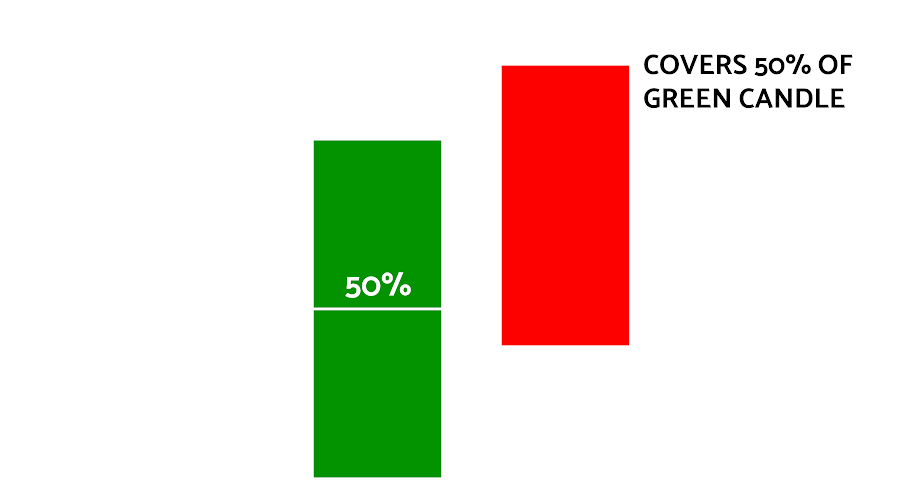
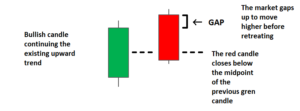
The Dark Cloud Cover pattern is a candlestick pattern that signals a potential reversal to the downside. It appears at the top of an uptrend and involves a large green (bullish) candle, followed by a red (bearish) candle that creates a new high before closing lower than the midway point of the previous green candle.
This candle formation, although very similar, should not be confused with the Bearish Engulfing candle pattern. Both patterns signal a potential trend reversal but the Dark Cloud Cover offers more attractive entry levels due to a higher close of the bearish candle than that observed with the bearish engulfing candle pattern.
HOW TO IDENTIFY A DARK CLOUD ON FOREX CHARTS
Dark Cloud Cover checklist:
- Identify existing uptrend.
- Look for signals that momentum is slowing/reversing (stochastic oscillators, bearish moving average crossover, or subsequent bearish candle formations).
- Stocks will gap up, with the red candle opening above the previous green candle however, this is very rarely found in forex candlesticks as these candles will mostly open at the same level as the prior candle’s close, or very close to it.
- Ensure that the red candle closes lower than the midway point of the previous green candle.
- Look for confirmation of the new downward trend
HOW TO TRADE USING THE DARK CLOUD PATTERN
Traders can look to trade more traditional trending markets such as the GBP/USD or EUR/USD, but can also incorporate Dark Cloud Cover technical analysis in ranging markets.
Trending markets
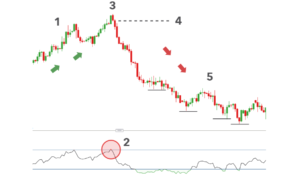
Below is an example of the Dark Cloud Cover pattern in forex, specifically, the GBP/USD forex pair. Refer to the chart for more information.
Learn – What is Gravestone Doji Candlestick Pattern?
This Dark Cloud Cover checklist can be used to analyze a potential trade:
- The existence of higher highs and higher lows presents us with an uptrend.
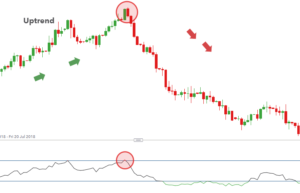
- On the chart, one can observe that the market had started to move more sideways as the latest upward move initially moved sideways and when it did move up, this was not as sharp a move as previously observed. Furthermore, the RSI moved into overbought territory providing a greater level of conviction to the trade.
- The red candle gaps slightly above the previous green candle. In the forex market the candle will mostly open at the same level as the previous close.
- The red bearish candle proceeds lower and closes below the midway point of the bullish candle, showing that the bears are outweighing the bulls at that level.
- Confirmation of continued selling (downward pressure) is seen in the very next candle and subsequent candles after that. Lower highs and lower lows then provide the evidence that the market had reversed successfully, and a downtrend was established.
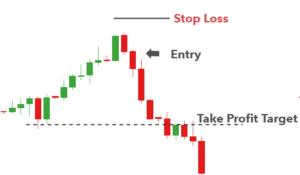
Entry levels, targets and stops can be easily identified when taking a look at the zoomed in chart below. The entry can be placed at the open of the next candle, after the Dark Cloud Cover pattern has formed.
Stops can be placed above the recent swing high and the initial target level can be set at key levels or recent areas of support/resistance. It is worth noting that because the trade is potentially the starting point of an extended move down, traders can set multiple target levels.
FOLLOW WA NOW WhatsApp channel!