Double Bottom Chart Patterns

Double Bottom Chart Patterns

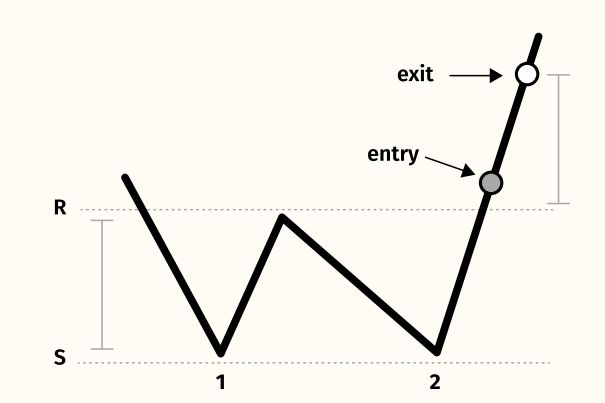
A Double Bottom pattern in forex is a bullish reversal trading pattern and looks like “W”. The first bottom forms immediately after a strong bearish trend, price then retraces to the neckline. Once it hits this level, the momentum will shift to bearish once again to form the second top. When it bounces back to … Read more

Triple Bottom Chart Patterns

Tripple Bottom Chart Patterns

Triple Bottom formation is the mirror image of the Triple Top. After an extended decline to new lows a stock puts-in a bottom on massive volume and a moderate rally ensues. After several sessions (sometimes weeks) the stock drifts back to test the first bottom and once again buyers push the stock higher. This process … Read more

Triple Top Pattern

Triple Top Pattern

A triple top formation is a distinct chart pattern characterized by a rally to a new high followed by a moderate pullback and a second rally to test the new high. As the stock rallies to make the second peak (top) sellers overwhelm buyers and the stock price falters again This process is repeated a … Read more

Three Black Crows Candlestick Pattern?

Three Black Crows Candlestick Pattern?

Three Crows pattern is a multiple candlestick chart pattern that is used to predict reversal to the downtrend. This candlestick pattern is formed when the bearish forces come into the action and make the prices fall for three consecutive days. Traders should take a short position after this bearish candlestick pattern is formed. Traders can … Read more

Inside Bar pattern

Inside Bar pattern

The Bearish Inside Bar pattern is a trading pattern that indicates the end of an upward direction in the market and signals a downward direction. This pattern is formed by two candlesticks. The first candlestick is an upward one, and the second candlestick is a downward one which does not completely encompass the body of … Read more

Bearish Harami Pattern

Bearish Harami Pattern

The Bearish Harami pattern is a reversal pattern appearing at the top of an uptrend. It consists of a bullish candle with a large body, followed by a bearish candle with a small body enclosed within the body of the prior candle. As a sign of changing momentum, the small bearish candle ‘gaps’ down to … Read more

What is Shooting Star Pattern ?

What is Shooting Star Pattern ?

A shooting star is a type of candlestick pattern that forms when the price of the security opens, rises significantly, but then closes near the open price. The distance between the highest price of the day and the opening price should be more than twice as large as the shooting star’s body. It occurs at … Read more

What is Tweezer Top pattern?

What is Tweezer Top pattern?

The Tweezer Top pattern is a bearish reversal candlestick pattern that is formed at the end of an uptrend. It consists of two candlesticks, the first one is bullish and the second one is the bearish candlestick. Both the tweezer candlestick make almost the same high.   What does Tweezer Top Candlestick Pattern tell us? … Read more

What Is Dark Cloud Cover Pattern?

What Is Dark Cloud Cover Pattern?

The Dark Cloud Cover pattern is a candlestick pattern that signals a potential reversal to the downside. It appears at the top of an uptrend and involves a large green (bullish) candle, followed by a red (bearish) candle that creates a new high before closing lower than the midway point of the previous green candle. … Read more