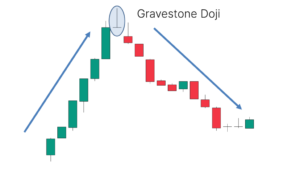
The Gravestone Doji candlestick pattern can be interpreted as a bearish reversal when it occurs at the top of uptrends. The Gravestone Doji can help traders see where resistance to a pricing increase is located. It is typically used with other technical indicators to identify a possible uptrend.
What does Gravestone Doji look like?
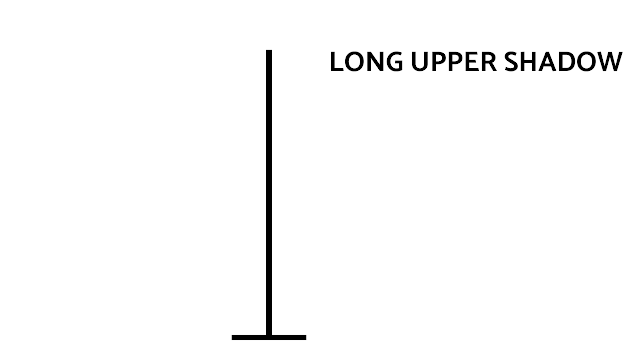
The Gravestone Doji chart pattern is an inverted “T”-shaped candlestick that’s created when the open, high, and closing prices are nearly equal. The most important part of the Gravestone Doji is the long higher shadow.
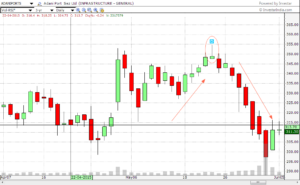
Adani Ports
learn – What is the Bearish Engulfing Pattern?
In the daily chart of Adani ports, we can see a Gravestone Doji formation on the date 22.05.2015. The Doji was formed with a prior uptrend from the levels of 300 to 348.।
Andhra Bank:
This was a rally of 16 percent and after the formation of the Gravestone Doji, the stock fell from the level of 350 to the levels of 298 which was again a fall of about 15 percent
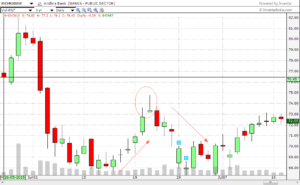
This daily chart of Andhra bank is another example of the Doji pattern. With a prior uptrend of about 7% from the level of 68, it formed at Doji at 73 and then reversed its trend to go back to the levels of 69.
Chart Example
FOLLOW WA NOW WhatsApp channel!