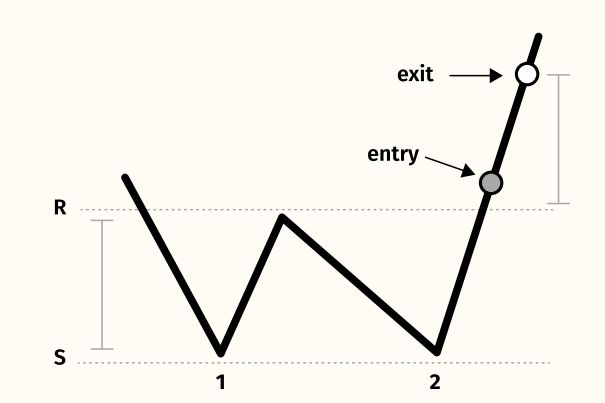
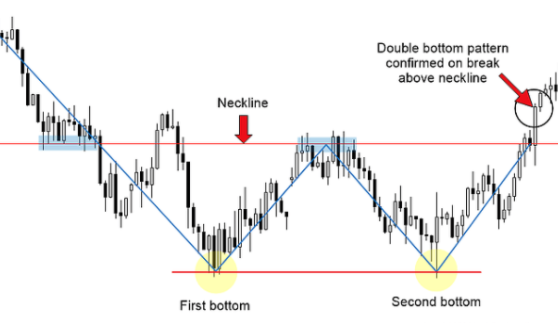
A Double Bottom pattern in forex is a bullish reversal trading pattern and looks like “W”. The first bottom forms immediately after a strong bearish trend, price then retraces to the neckline. Once it hits this level, the momentum will shift to bearish once again to form the second top. When it bounces back to the neckline again, it then forms a double Bottom.
Timeframe:
- Applys to all timeframe
Double Bottom
EXAMPLE-1
Notes:
- The pattern is considered complete when price breaks the highs or resistance line.
- Identify a bearish/down trend.
- spot the two bottoms in the bear trend. Draw the Neck Line
- Wait for the Neckline Breakout
- If the price closes above the Neck Line with a big bearish candlesticks, This confirm the breakout
- Increase in volume near the Neck line determines the perfect breakout
Target TAKE PROFIT:
- Measure the size of the pattern(height) from the neckline to the lowest bottom and then apply it upwards starting from the Neck Line. This would be your minimum target profit.
Stop LOSS:
- Put your stop level slightly below the lower low/bottom (1st or 2nd) of the pattern. If both bottoms are on the same level, put your stop level slightly below the lows/ bottoms.
FOLLOW WA NOW WhatsApp channel!
[Disclaimer: This article is for informational purposes only and should not be construed as investment advice in any way. financestock.in advises its readers and viewers to consult their financial advisors before taking any money-related decisions.]