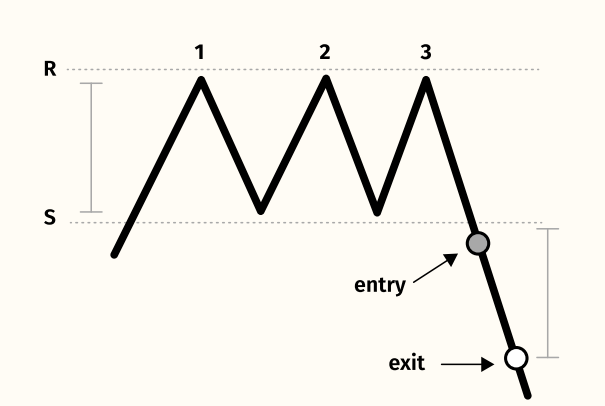
A triple top formation is a distinct chart pattern characterized by a rally to a new high followed by a moderate pullback and a second rally to test the new high. As the stock rallies to make the second peak (top) sellers overwhelm buyers and the stock price falters again This process is repeated a third time but buyers finally submit, support levels are broken and a massive decline ensues.
Timeframe:
- Applys to all timeframe
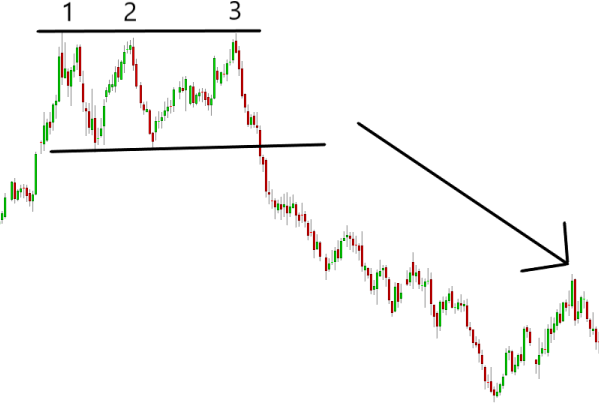
EXAMPLE-1
Notes:
- A triple top chart pattern is a bearish reversal chart pattern that is formed after an uptrend.
- This pattern Is formed with three peaks above a support level/neckline.
- This pattern is formed with three peaks below a resistance level/neckline
- For triple top volume must increase as the stock moves toward the top of the pattern. Increased volume at the Top of the pattern suggests that accumulation is taking place.
- No triple top is truly complete until the stock in question closes below the lows made during the trough between tops #2 and #3
- Increase in volume near the Neck line determines the perfect breakout
Target TAKE PROFIT:
- Measure the size of the pattern(height) from the neckline to the Highest Top and then apply the same distance to the downside starting from the Neck Line.
Stop LOSS:
- Put your stop level slightly above the higher low/bottom of the three tops in the pattern. If all are on the same level, put your stop level slightly above the tops or support level.
FOLLOW WA NOW WhatsApp channel!
[Disclaimer: This article is for informational purposes only and should not be construed as investment advice in any way. financestock.in advises its readers and viewers to consult their financial advisors before taking any money-related decisions.]