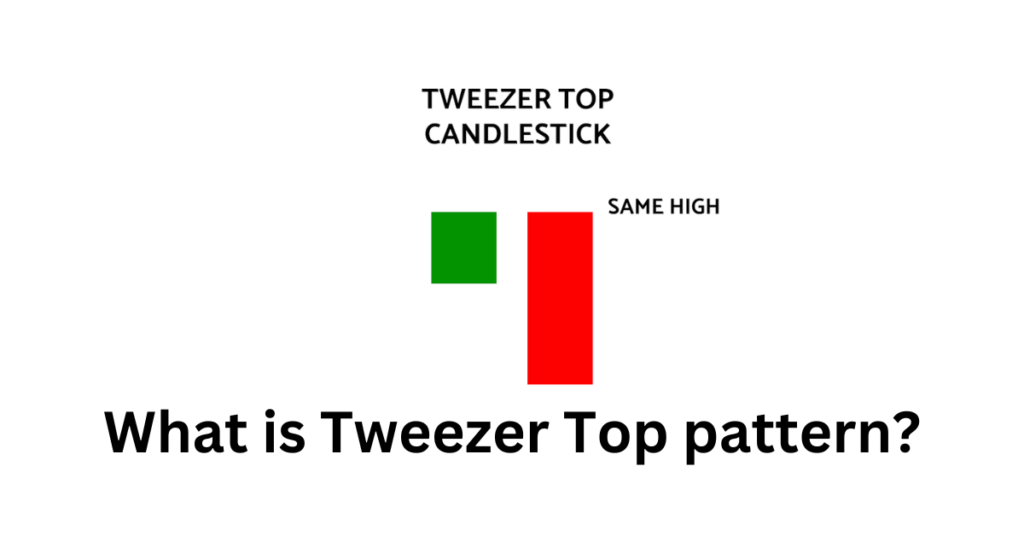
The Tweezer Top is a bearish reversal candlestick pattern that appears at the end of an uptrend. It consists of two candles:
-
First Candle: A bullish candle (white or green)
-
Second Candle: A bearish candle (black or red) that has:
-
A similar high to the first candle
-
A lower close than the first candle
-
The Tweezer Top pattern indicates that the bears are gaining control, and the price may start falling.
-
The identical highs suggest a rejection of the previous uptrend.
-
Sell or short the asset when the second candle closes below the midpoint of the first candle’s body.
-
Set a stop-loss above the high of the second candle.
-
Target a price level that is equivalent to the height of the Tweezer Top pattern.
-
Tweezer Bottom: A bullish reversal pattern that appears at the end of a downtrend.
-
Tweezer Top and Bottom can also be part of a larger pattern, such as a Double Top or Double Bottom.
What does Tweezer Top Candlestick Pattern tell us?
When the Tweezer Top candlestick pattern is formed the prior trend is an uptrend.
A bullish candlestick is formed which looks like the continuation of the ongoing uptrend.
On the next day, the high of the second day’s bearish candle’s high indicates a resistance level.
Bulls seem to raise the price upward, but now they are not willing to buy at higher prices.
The top-most candles with almost the same high indicate the strength of the resistance and also signal that the uptrend may get reversed to form a downtrend.
This bearish reversal is confirmed on the next day when the bearish candle is formed.
Importance of this pattern:
When the traders see the formation of tweezer top and bottom candlestick patterns on the charts, they should get cautious that a reversal is going to place.
They should square off their position when this reversal pattern forms.
They should also confirm the formation of the tweezer candlestick pattern with other technical indicators.
Learn – What Is Dark Cloud Cover Pattern?
Key Takeaways:
- Tweezer Top and Bottom candlestick is a trend reversal pattern that involves two candlesticks.
- Tweezer top candlestick indicates a bearish reversal whereas Tweezer bottom indicates a bullish reversal.
- When the traders see the formation of tweezer candlestick patterns on the charts, they should get cautious that a reversal is going to place.
- Traders should also confirm the formation of the tweezer candlestick patterns with other technical analysis indicators.
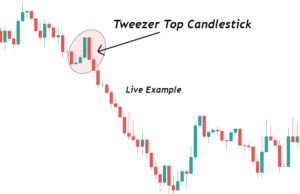
Live Example:

FOLLOW WA NOW WhatsApp channel!